1. Meeting the Brief
Meeting the Basic Requirements
-
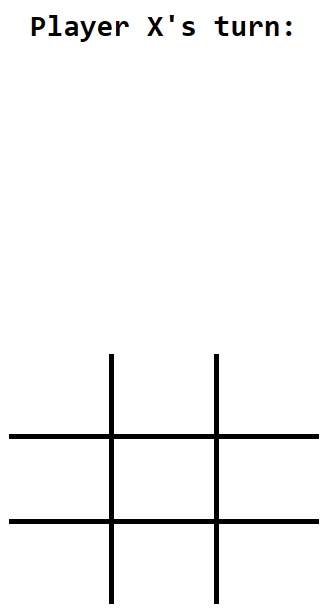
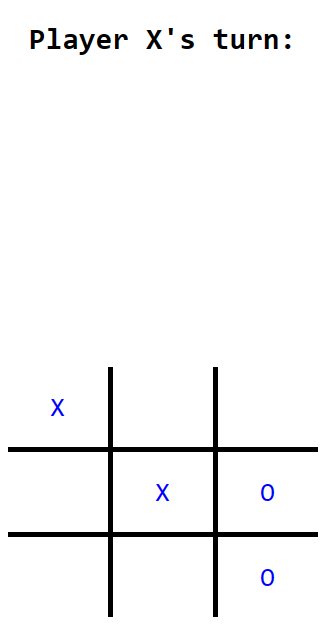
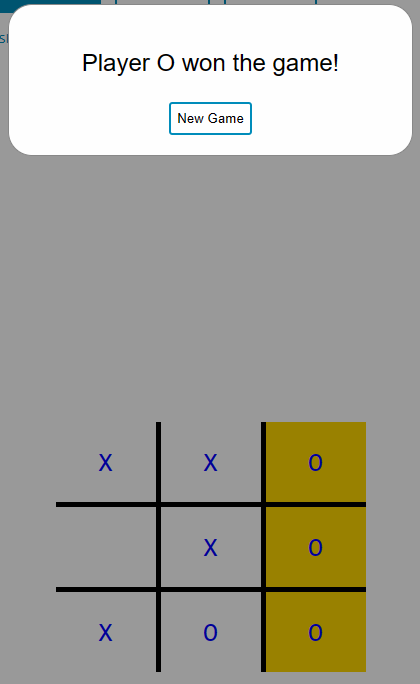
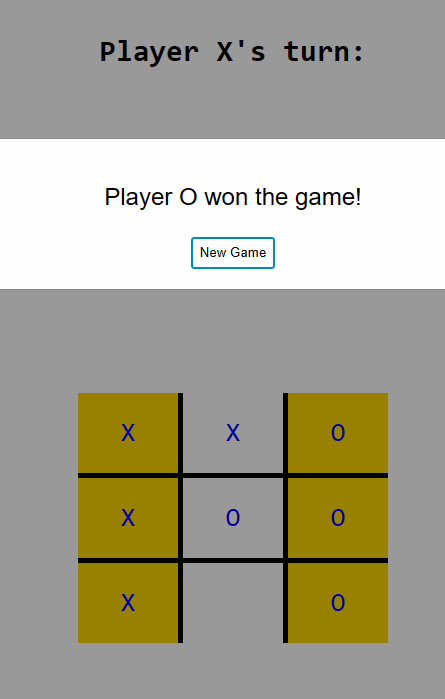
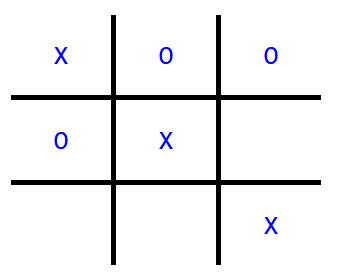
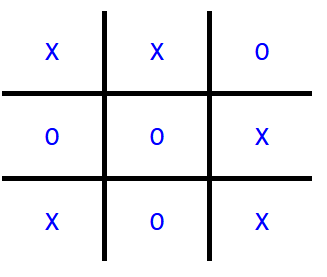
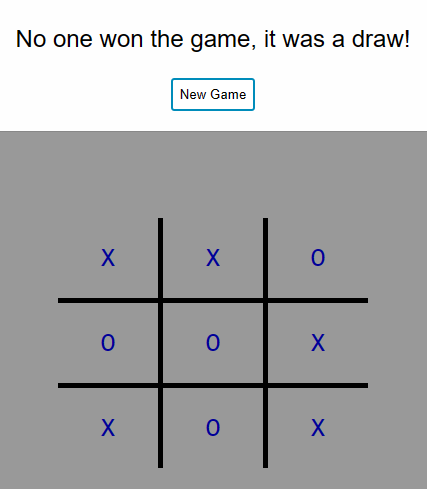
In my project, I created a computer model of the game X's and O's. My implementation of the game includes a webpage that you play the game on. Initially, the player starts off with an empty board. Then the player can play the game to completion either against the computer or against another human player. The images below show the game board at the start, halfway through and when the game ends.
In this example, the human player (X) is playing single-player against the computer player (O) which uses a simple strategy of picking a random space on the board to play each turn.
The computer player (O) wins this game.
-
The game takes in multiple inputs and validates each of them to ensure it runs correctly.
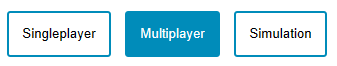
- The player chooses which game mode by clicking one of three buttons or changing the parameter in the url bar. It ensures that the game mode is valid.
- It processes the user input on the board with clicks. Once a box is clicked, the program checks that the box exists and not already taken.
- In simulation mode, the game takes a number input that controls how many simulations are ran. This input is validated to ensure it is a positive integer.
Below are three images of the inputs in my model.
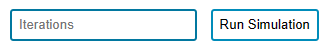

-
As mentioned above, the game can be played interactively among three game modes. You can play single-player against the computer, multiplayer with two human players or have no human players and the computer will run a simulation where it plays against itself. In simulation mode, there is an input box allowing you to input the amount of times you want the simulation to run. This collects data for analysis.
Meeting the Advanced Requirements
-
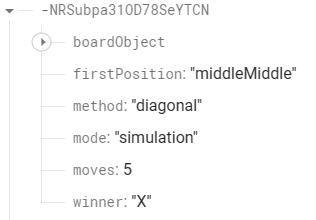
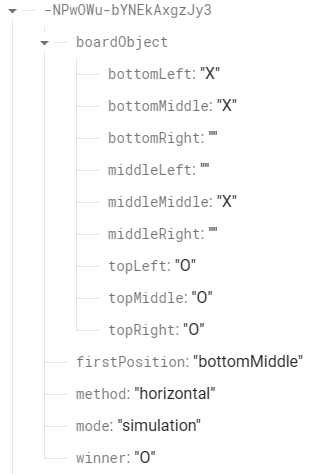
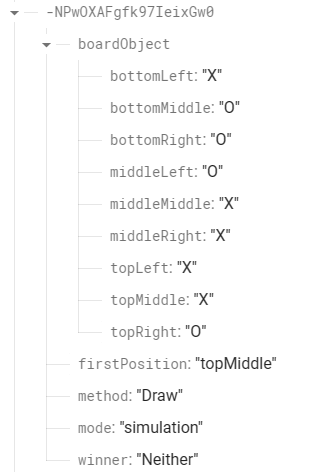
In order to provide the ability to collect data on each game. Each time the game is finished, my model runs a function to save the game to a Firebase Realtime Database. The data is stored under a primary key, including:
- Game winner
- Game mode
- Win method
- No. of moves
- First position
- Board state
Shown below are images of some Firebase records.
-
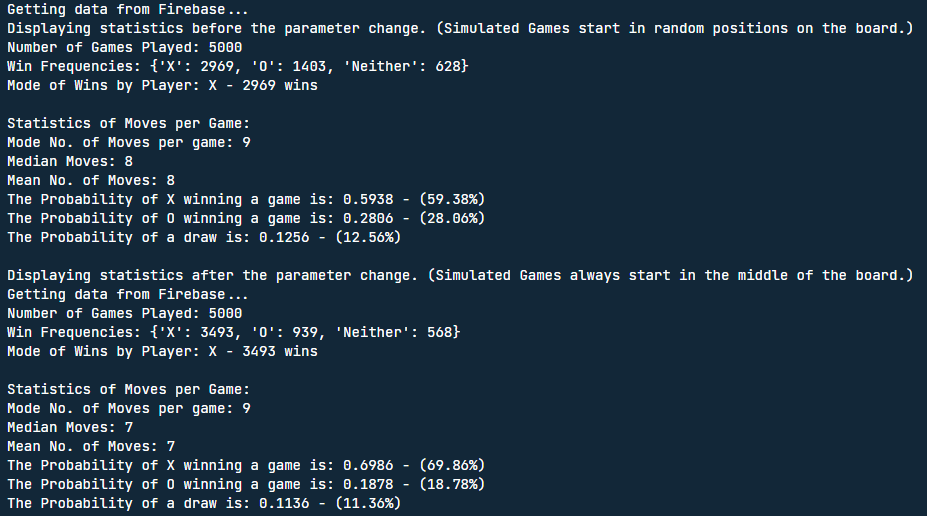
My project includes a separate Python file Artefact/analysis.py. This preforms statistical analysis on the collected data from Firebase. It finds the frequency and mode of wins. And the mode, median and mean of moves in each game. It generates the probability of each player winning. I then used matplotlib to generate graphs.
-
The hypothesis I investigated was, if your first position was the very centre of the board, did this give you a greater chance of winning. To investigate, I implemented a variable SIMULATION_FIRST_POSITION which would force the simulation to start in the set position every game. I set this to "middleMiddle" which ensured the game started in the middle of the board. I then ran 5000 simulated games of both random and set to the centre starting positions. With the data collected, I compared the results. These are shown in evaluation.

2. Investigation and Plan
The 2023 Leaving Certificate Computer Science Project is to develop a game. The model of the game should include a single-player, multi-player, and a computer only (simulation) mode. The four components which I needed to consider in the modelling process are shown in the diagram below.
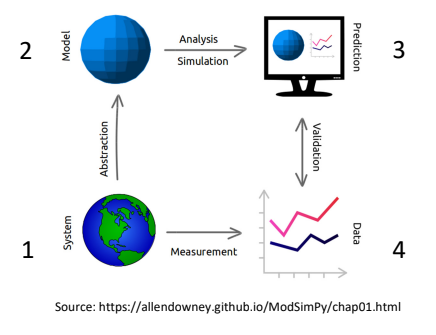
The brief also gave some suggestions such as card games, games with dice, board games or children's games.
My choice was based on the following criteria:
- The challenge of designing and implementing a model of the game. How easy would it be to program? How suitable it was to be played via the python terminal or a webpage.
- The appropriateness of the game for the simulation. Is it possible to implement a computer player that could play against a human or itself using randomness as this was specified in the brief.
- Were there aspects of the game that data analytics could be carried out on, this was a requirement for the project. This required creating a hypothesis, testing it and modelling data.
Before deciding on my game, I researched games from each suggested category. These games were:
- Snap
- snakes-and-ladders
- X's and O's
- rock-paper-scissors
Although 1, 2 and 4 were quite feasible for my project, after further research, I decided that these games would be too difficult to display in a console or webpage, i.e. snakes-and-ladders. Performing analysis on these games seemed limited as there wasn’t much involved, i.e. snap. Rock-paper-scissors is a purely random game. There is no strategy in the game.
I then came to the final decision of modelling X's and O's. It met my criteria listed above.
Before coding, I carried out some research. The suggestions links given in the brief [1]-[5] gave me insight into physical models and simulations. [6] aided me with understanding analytics, and [7] taught me about abstraction. I also used our course textbook [8] for data analysis and Firebase. For help creating my websites I used w3 schools [9] and the MDN docs [10], to assist in Javascript and web design. I found Google's version helpful. [12] This gave me a lot of inspiration. Their version was more complex. It included the computer player to have strategy. Although for my implementation I was going to focus on the main functionality of the game, with randomness and the ability to collect data.
Objectives
- Play the game to completion with another human player or against the computer (using randomness).
- Be able to interact with the game in a visually appealing, intuitive way.
- Run the game a number of times, computer vs computer (simulation).
- Record data from each game, who won, how they won, their first position, etc.
- Carry out data analysis.
3. Design
The first stage of the design process is to develop a flow chart which models the high-level operation of the game. This would allow me to model each part of the code easier as I could visualise the flow of the game code. It also would help when creating functions. The high level flowchart is shown below.
Flowchart
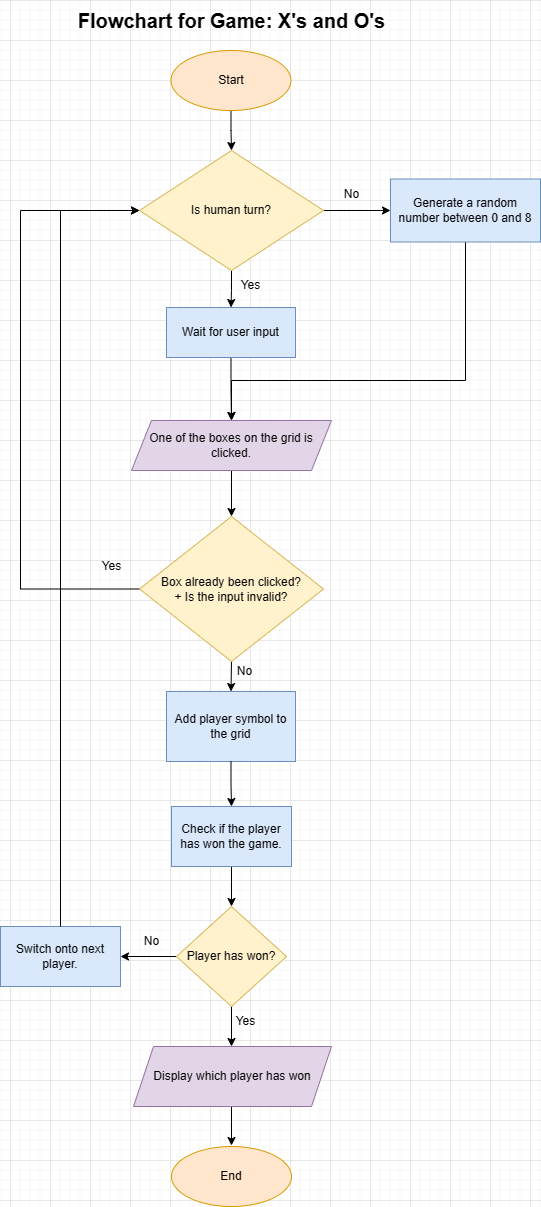
The flowchart displays each operation of the game. It shows the two inputs the game can have, a human input or a randomly generated computer input. At the start of each iteration, a conditional statement branches the flow based on is it the human's turn or the computer's? If it is a human player, it waits for the human player to input their position and for the computer player, it generates a random number between 0 and 8 (9 in total corresponds to each spot on the game grid). In both cases the system checks if it is a valid input and if the box has already been clicked. If it isn't valid or if it has already been clicked, it iterates back to the start. This part of the flowchart captures the input validation.
In modelling the X's and O's game. One of the most important design decisions was how my game was going to display an abstract of the board game. This was a very important decision because it was the key to how the rest of the game was going to work. E.g. Implementing the ability for the computer to play and the algorithm for checking if either player has won the game. I needed to filter out the complex features and focus on the key functions.
To address this design decision, I decided to implement the game board visually using CSS Grid, and by using an object in Javascript to hold each cell's status. (E.g. topLeft: “X”, etc). I also considered using a list of lists (also known as an array or arrays) but I thought the object would be cleaner and more efficient to use.
This will then make it easy to collect data for later analysis as I can just iterate over this game a number of times.
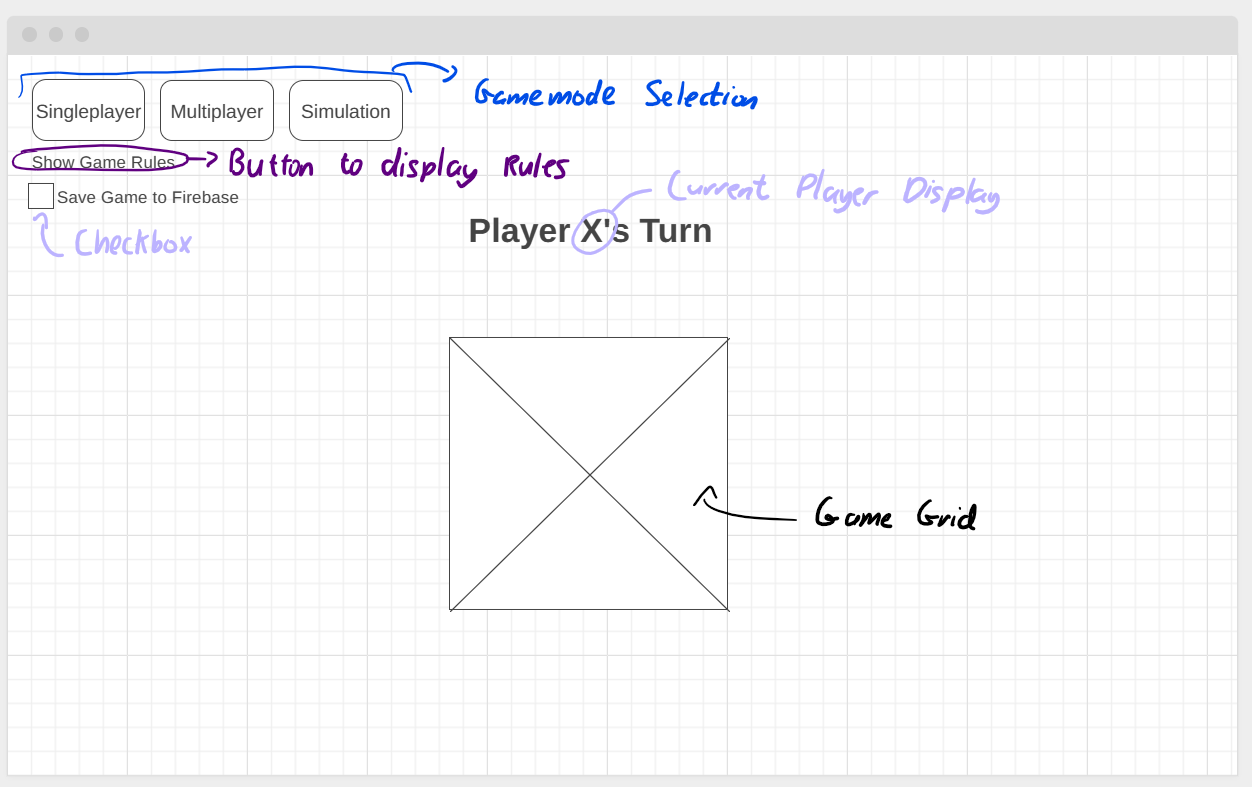
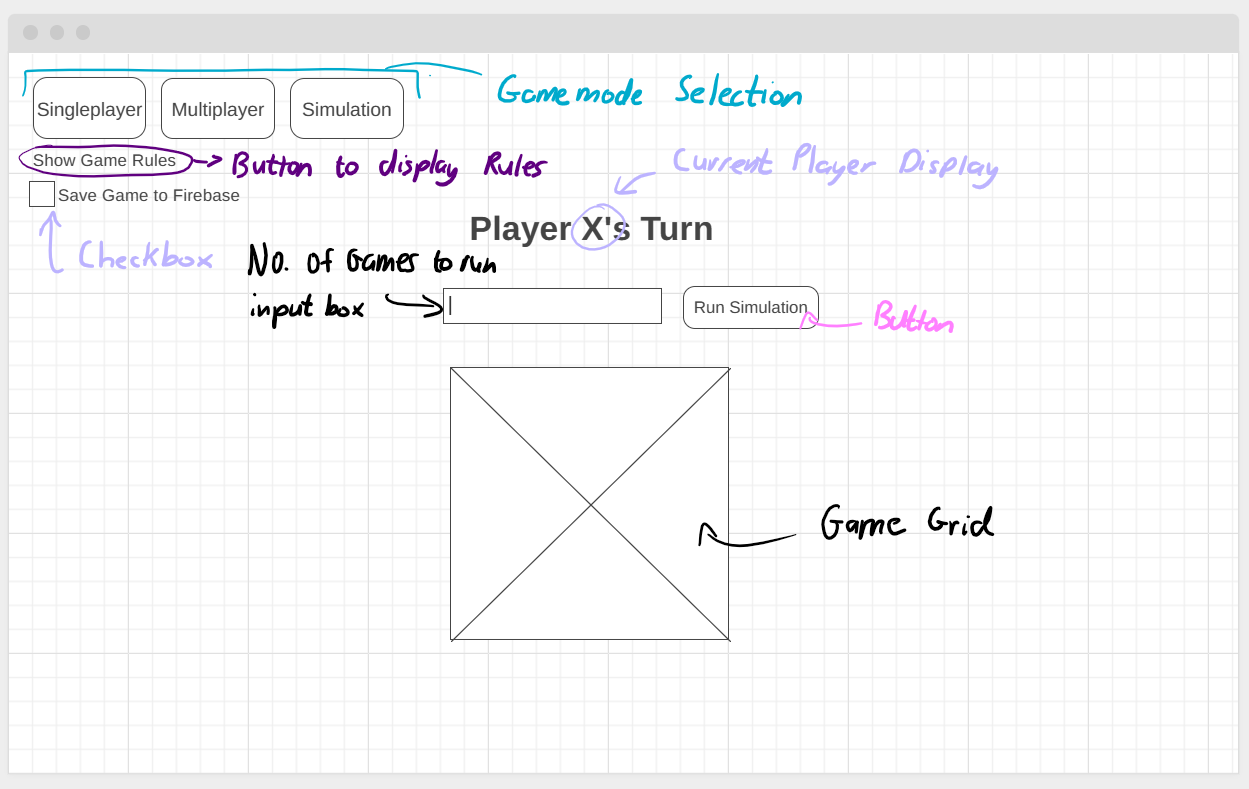
Wireframes
As I was making this game on a webpage, I decided to make some Wireframes to display a general design for the app. I wanted something simple to understand, accessible to everyone and clutter free (universal design). Below are two (annotated) wireframes.
4. Implementation
In order to successfully complete my project, I used an iterative approach to developing my model. I used decomposition to divide my implementation into the following milestones.
- The game board/grid, where the game was displayed and played.
- The buttons and system to control what game mode is currently active.
- Managing the 2 players and determining when it was their turn to go.
- Using randomness to emulate a computer player.
- The algorithm to check if a player has won the game or if it was a draw.
- Simulation mode where the game will run itself an inputted number of times.
- Logging game information in the database for later analysis.
The final model of X's and O's is included in my project submission in the Artefact folder as index.html. It then uses the styles.css & script.js located in the same folder to run the game.
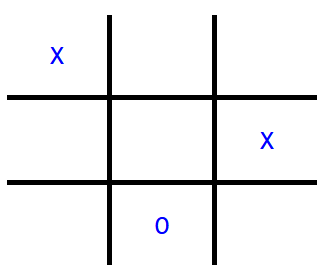
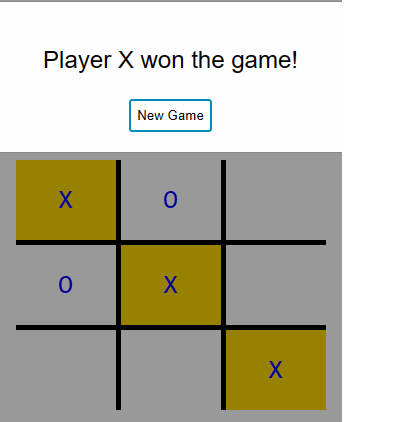
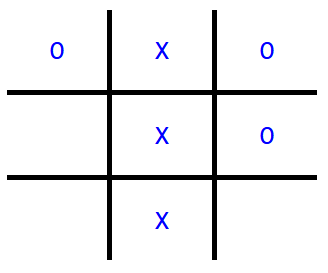
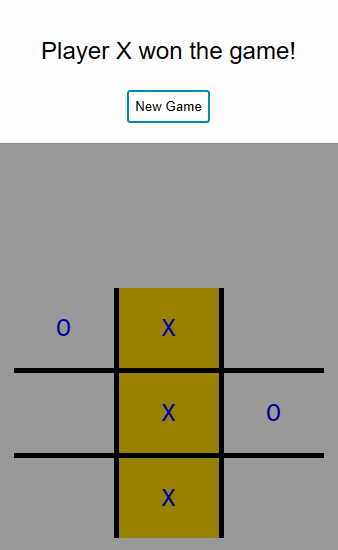
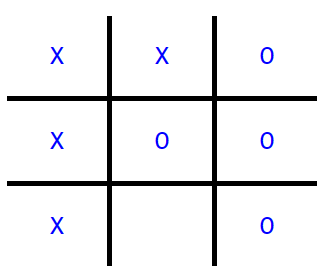
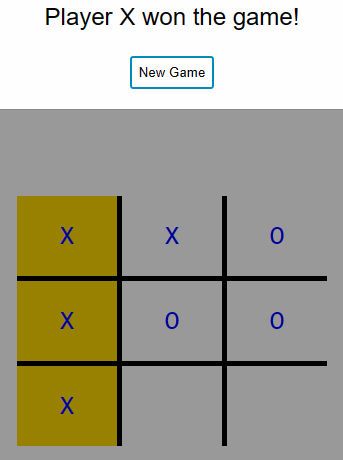
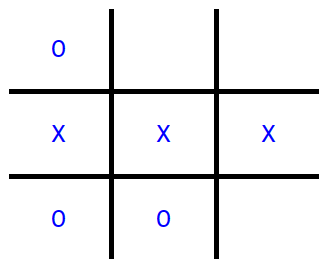
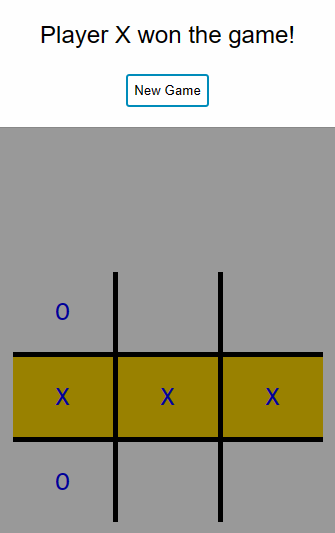
As I was working through my process of development, I encountered a difficult problem. After I had implemented the system to check if a win had occurred, and after running some simulations and single player games, I noticed that it was possible for both X and O to win the game, depending on the scenario (if the next move after X had won was also a win for O). Below is an image of this happening.
As seen, both X and O won. This required a lot of debugging my code, printing variables to the console, commenting out sections of code until I finally identified the issue. I realised that when a win was triggered, it would not stop the computer from making its next move. This meant that in some cases the computer would make another move which would also be a win. Ultimately, this triggered the game to win twice, as seen above. To combat this, I set up a variable called gameOver. This boolean was false by default. As soon as a win or a draw was triggered, it was set to true. I implemented an if statement in the computedMove() function to ensure that the game was not over before allowing the next move. This resolved the issue. Below shows my fixes.


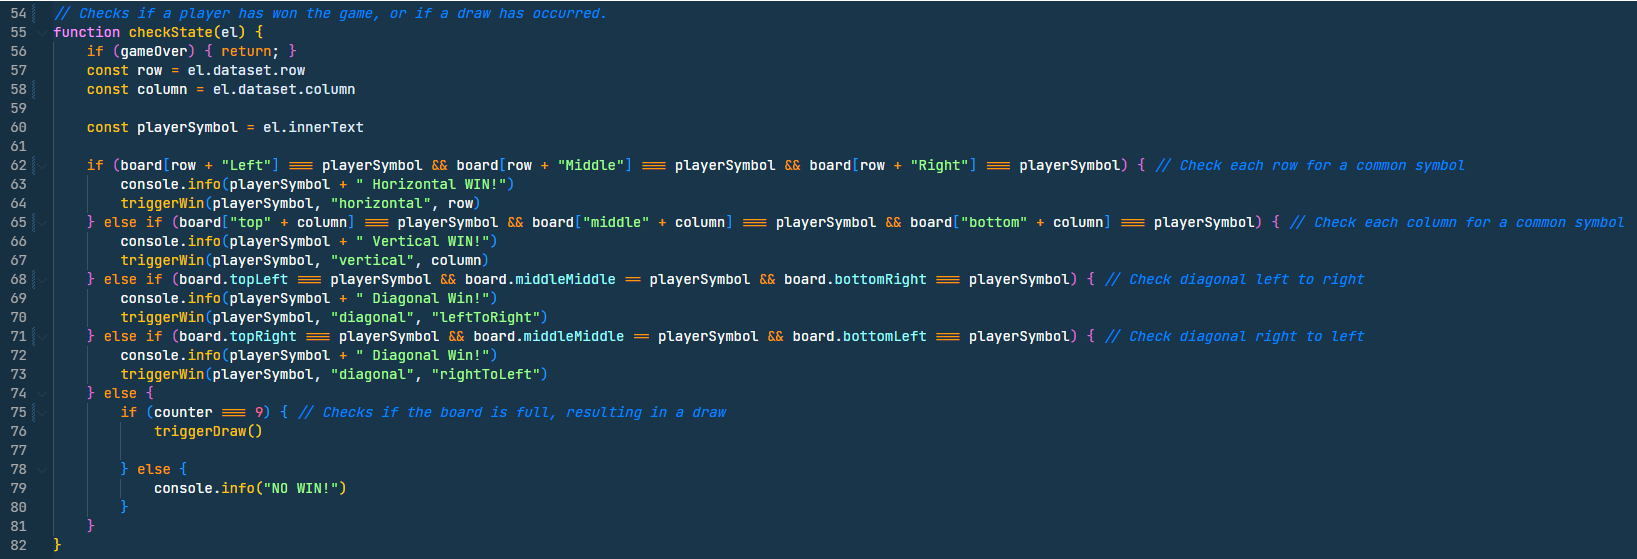
The most important and essential algorithm in my model was to check if there was a win present on the board or there was a draw. This required inspecting each row, column and each diagonal, to check if there was a row of all X's or O's. Or if there are no more empty spaces on a board, there has been a draw. This algorithm is in the function checkState() “Artefact/script.js (line 55 - 82)”
The function uses the following algorithm:
- Inspect each row for a common symbol
- Inspect each column for a common symbol
- Inspect left to right diagonal for a common symbol
- Inspect right to left diagonal for a common symbol
- Ensure that there is space left on the board, i.e. a draw has not happened.
An image of the function is shown below.
5. Testing
Testing is an important aspect of my model. I needed to ensure the game would run smoothly and error free. Through out developing, I used console.log() and print() functions to assist me on debugging and what was going on in the code. As my game was in HTML, the browser element inspector was also very useful.
Test Case Table for the checkState() function.
| ID | Description | Test Data | Expected Result | Actual Result | Passed/Failed |
|---|---|---|---|---|---|
| 1 |
Test that game will continue if there is no win or draw. |
let board = { "topLeft": "X", "topMiddle": null, "topRight": null, "middleLeft": null, "middleMiddle": null, "middleRight": "X", "bottomLeft": null, "bottomMiddle": "O", "bottomRight": null} |
"NO WIN!" |
"NO WIN!" |
Passed ✔ |
| 2 |
Test that the game will win if X gets a diagonal win. |
let board = { "topLeft": "X", "topMiddle": "O", "topRight": "O", "middleLeft": "O", "middleMiddle": "X", "middleRight": null, "bottomLeft": null, "bottomMiddle": null, "bottomRight": "X"} |
"X Diagonal Win!" |
"X Diagonal Win!" |
Passed ✔ |
| 3 |
Test that the game will win if X gets a vertical win. |
let board = { "topLeft": "O", "topMiddle": "X", "topRight": "O", "middleLeft": null, "middleMiddle": "X", "middleRight": "O", "bottomLeft": null, "bottomMiddle": "X", "bottomRight": null} |
"X Vertical Win!" |
"X Vertical Win!" |
Passed ✔ |
| 4 |
Test that the game will draw when the grid fills up. |
let board = { "topLeft": "X", "topMiddle": "X", "topRight": "O", "middleLeft": "O", "middleMiddle": "O", "middleRight": "X", "bottomLeft": "X", "bottomMiddle": "O", "bottomRight": "X"} |
"triggerDraw()" |
"triggerDraw()" |
Passed ✔ |
| 5 |
Test that the game will handle two wins occurring at the same time. |
let board = { "topLeft": "X", "topMiddle": "X", "topRight": "O", "middleLeft": "X", "middleMiddle": "O", "middleRight": "O", "bottomLeft": "X", "bottomMiddle": null, "bottomRight": "O"} |
"X Vertical Win!" |
"X Vertical Win!" |
Passed ✔ |
| 6 |
Test that the game will win if O gets a horizontal win. |
let board = { "topLeft": "O", "topMiddle": null, "topRight": null, "middleLeft": "X", "middleMiddle": "X", "middleRight": "X", "bottomLeft": "O", "bottomMiddle": "O", "bottomRight": null} |
"X Diagonal Win!" |
"X Diagonal Win!" |
Passed ✔ |
Test Case Table for the Simulation Input Validation Function.
| ID | Description | Test Data | Expected Result | Actual Result | Passed/Failed |
|---|---|---|---|---|---|
| 7 | Test a positive integer. | 100 | true | true | Passed ✔ |
| 8 | Test a negative integer. | -200 | false | false | Passed ✔ |
| 9 | Test a string being inputted. | Hello World | false | false | Passed ✔ |
| 10 | Test a string. | C0mput3r | false | false | Passed ✔ |
| 11 | Test a random symbol and an integer (e.g. €20). | €200 | false | false | Passed ✔ |
The above table was created using a unit test function to test the validateSimInput() function.
Shown below is the code for the unit test function.
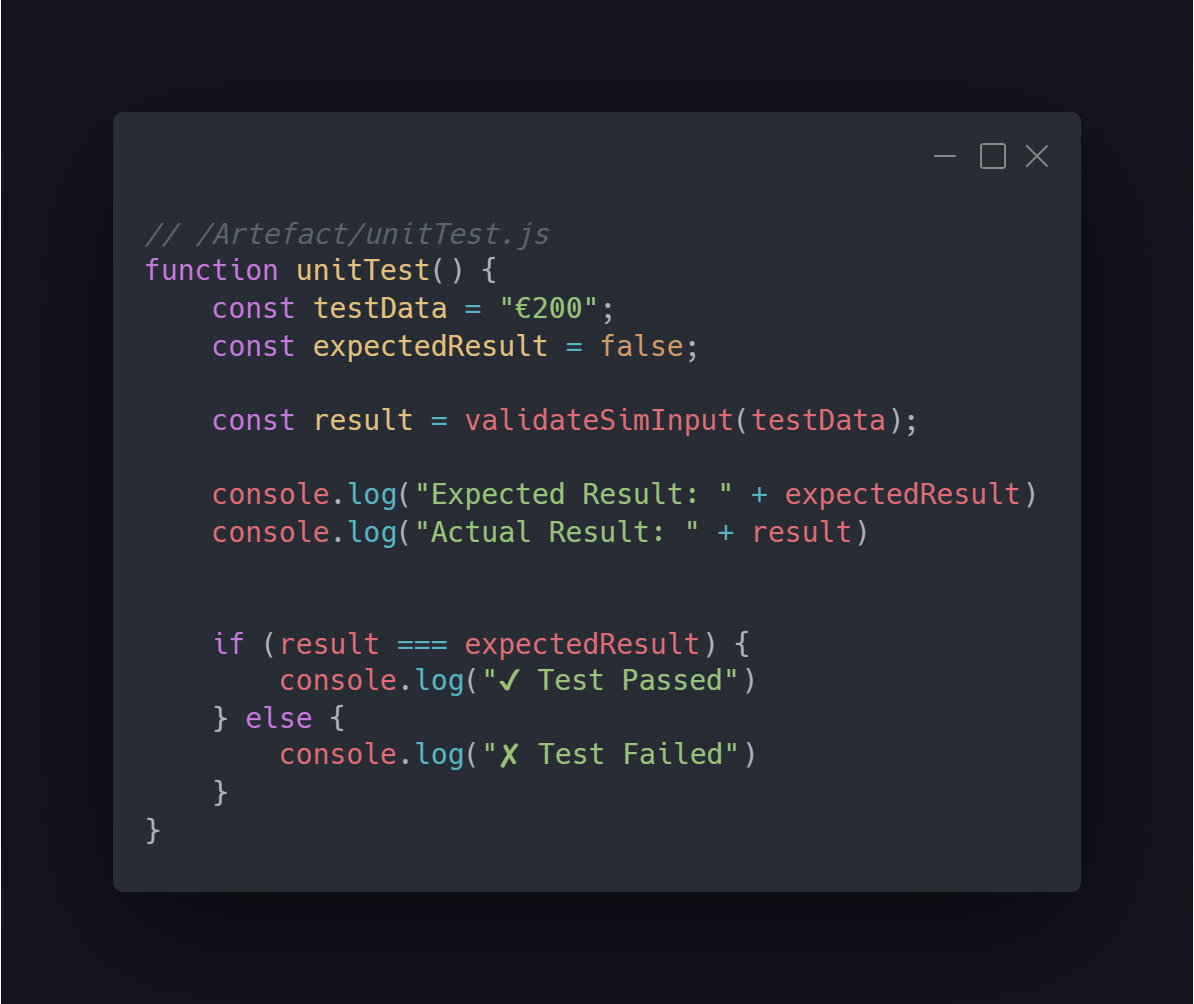
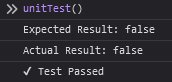
Shown below is the output of the function in the browser console. (Created with Carbon [5])
6. Evaluation
To evaluate my project, I looked back at the objectives I stated in Investigation and Plan, I successfully completed each. My game can run to completion featuring multiple game modes, with human players and random computer players. The game is interactive and visually appealing. My model also includes a simulation play, so it can be run a number of times. I also have implemented a Firebase Realtime Database which saves information from each game. I then performed data analytics on this data.
As my main output of the project, I created a model of a real world physical game, X's and O's. I researched before making this decision. Modelling the game included abstracting the physical game as a computer program. This involved representing the game board and the game state. I ensured the game followed the rules and proper game play. I used HTML, CSS and Javascript for this.
Upon review, my artefact could be improved and iterated on in the future. Mainly the computer player in the computedMove() function. Currently it has no intelligence or idea of the status of the game. It is very naive, it just picks a free location on the board. A big improvement would be to exhaustively check the board for free spaces that would result in the computer winning. Implementing something like this would make a more realistic simulation and make it more challenging for the player.
Data Analytics and Hypothesis Results
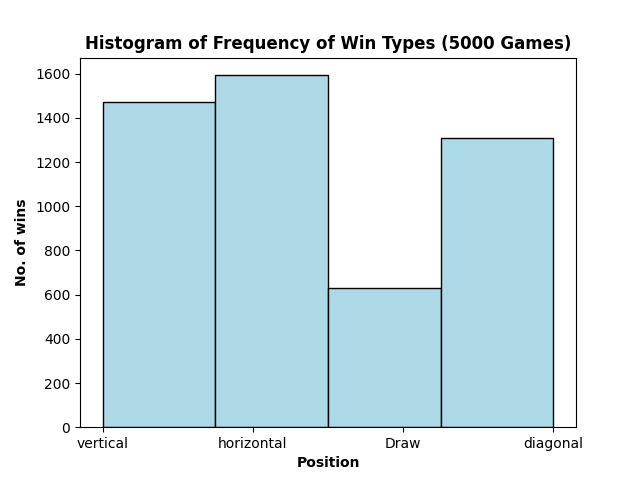
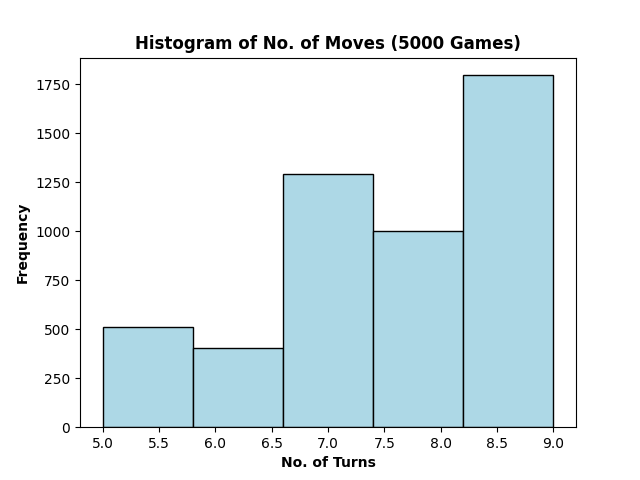
The hypothesis I posed was that if your first position was the very centre of the board, did this give you a greater chance of winning. I assumed this was true. Firstly, I ran 5000 simulation games with random starting positions. Below are the results in graphical format of these games.
To test my hypothesis, I then changed my parameter. This made every simulation game begin with X placing in the centre of the board. I then ran my data analysis again and compared the results. Below are 2 pie charts, the left from before the parameter change and the right from after the parameter change.
.png)
.png)
As you can see, X wins ~10% more times when it starts in the middle, verifying that my hypothesis was correct. Shown below is all the analytics carried out on all games. This also proves that X has more of a chance of winning. It also displays the mean, mode, medians and probabilities of the games.
7. References
- https://phet.colorado.edu/
- https://www.itgsnews.com/computer-models-simulations-models/
- https://education.mit.edu/project/starlogo-nova/
- https://www.youtube.com/watch?v=0ZGbIKd0XrM
- https://helloworld.raspberrypi.org/issues/10 (page 72)
- https://www.sas.com/en_us/insights/analytics/what-is-analytics.html
- https://www.gamedeveloper.com/design/levels-of-abstraction-in-game-design
- Computer Science for Leaving Certificate - Keith Quille (Our LCCS textbook)
- W3 Schools (Modal & HTML/CSS/JS assitance and reference)
- MDN Documentation
- Google Tic Tac Toe
- Carbon (for generating code snippet images)
8. Summary Word Count
| Section | Word Count |
|---|---|
| 1. Meeting the Brief | 500 |
| 2. Investigation and Plan | 443 |
| 3. Design | 405 |
| 4. Implementation | 500 |
| 5. Testing | 204 |
| 6. Evaluation | 401 |
| Total: | 2453 |